Percona Monitoring and Management 3.8.0
Release date: TBD
Percona Monitoring and Management (PMM) is an open source database monitoring, management, and observability solution for MySQL, PostgreSQL, MongoDB, Valkey and Redis. PMM empowers you to:
- monitor the health and performance of your database systems
- identify patterns and trends in database behavior
- diagnose and resolve issues faster with actionable insights
- manage databases across on-premises, cloud, and hybrid environments
📋 Release summary
TODO
✨ Release highlights
Grafana 12.4 upgrade
PMM 3.8.0 ships with Grafana 12.4, so you will notice several day-to-day monitoring improvements right away:
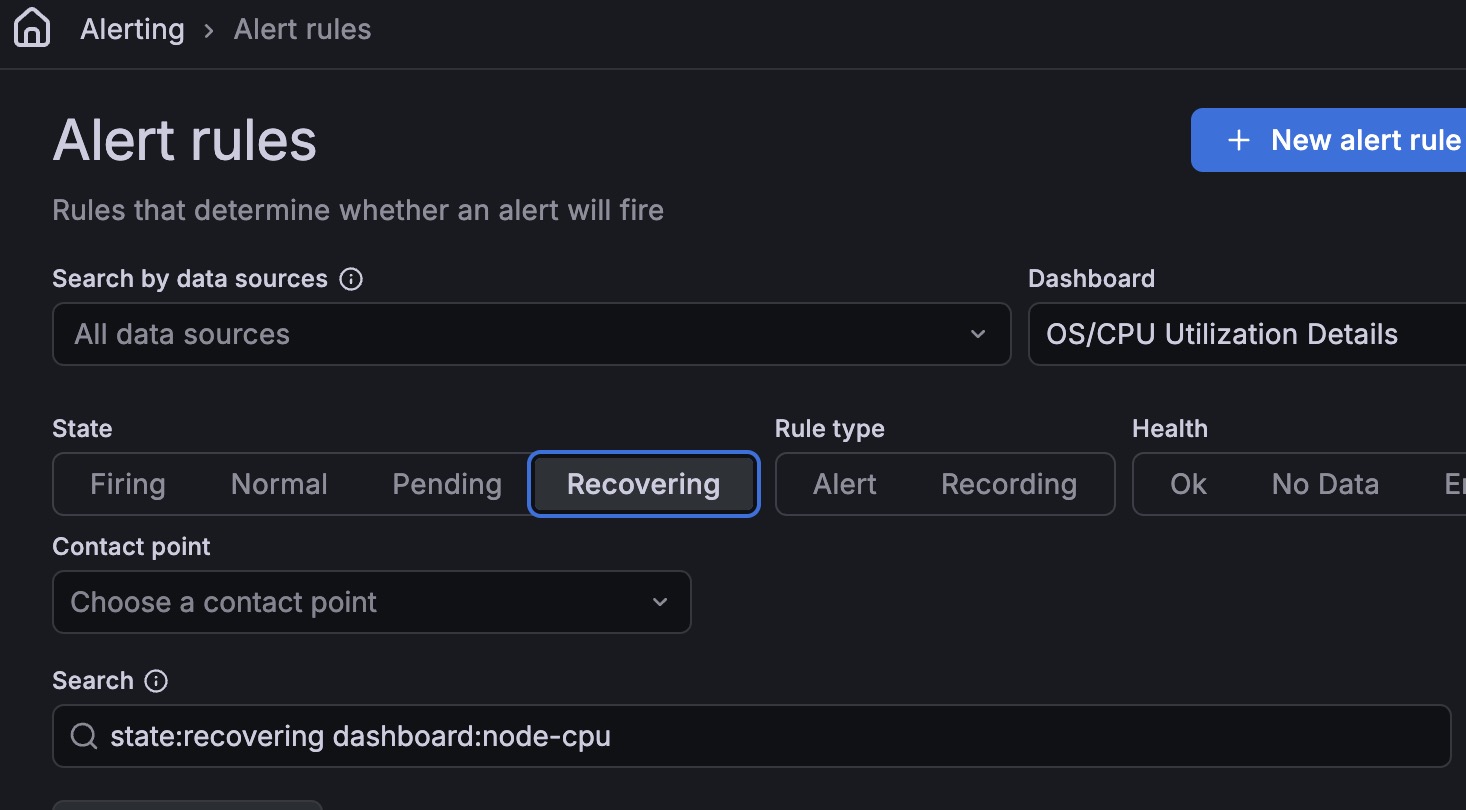
Less alert noise: Alert rules now support a Recovering state. This helps avoid repeated fire/resolved notifications when a metric keeps moving above and below an alert threshold, so you get fewer noisy alerts for spiky metrics like replication lag, query response time, and connection counts.
Faster monitoring dashboards: Tables in PMM dashboards load, sort, and filter significantly faster. This affects dashboards across PMM including Nodes Overview, MySQL User Details, PostgreSQL Instances Overview, MongoDB, and HA/PXC Cluster Summary.
Explore metrics now opt-in: Starting with Grafana 12, Explore metrics is no longer enabled by default. If you used it to visually browse metrics without writing queries, you need to re-enable it. Go to Users and Access > Plugins and data > Plugins, search for Grafana Metrics Drilldown, and click Enable. Once enabled, Explore metrics reappears under Explore in the left sidebar. See Enable Explore metrics.
Recording rules: Alert rules now support recording rules. A recording rule runs a query on a schedule and saves the result as a new metric, so your alerts reference the pre-computed result instead of re-running the full query on every evaluation cycle. This is especially useful when the same query powers multiple alert rules, for example, average CPU load across all nodes or replication lag across a cluster.
More changes in Grafana 12: Grafana 12 removes Angular support. If you have custom dashboards using legacy Graph (old) or Table (old) panels, they are automatically converted to Time series and Table panels the first time you open them after upgrading to PMM 3.8.0. For the full list of changes, see the Grafana 12 release notes.
📦 Components upgrade
- Grafana: Upgraded to 12.4.
🔒 Security updates
- PMM-15005: Removed a self-signed TLS certificate that was previously included in the PMM Server image to suppress ClickHouse startup log noise. Because the same certificate was shared across all PMM Server installations, CVE scanners flagged it as a security risk. Since ClickHouse in PMM doesn’t use TLS, the startup log noise is now suppressed without needing a certificate at all.
⚠️ Deprecations
- PMM-14968: UI-based upgrades are now officially deprecated and will be removed in PMM 3.9.0 (July 2026). PMM now shows a warning on all pages where UI-based upgrades were available. Switch to Docker, Podman, or Helm before then. If you use Watchtower, remove it before switching to avoid conflicts.
📈 Improvements
-
PMM-12392: Improved how PMM collects processlist data on MySQL 5.7.39+ and 8.0.22+ by switching from Information Schema to Performance Schema. On busy MySQL instances, this reduces the chance of query blocking and deadlocks, lowering the overall monitoring impact on your MySQL server workload.
-
PMM-14937: When adding a MySQL, PostgreSQL, MongoDB, ProxySQL, Valkey, Amazon RDS, or Azure service, you can now set a Connection timeout to control how long PMM waits before giving up on a connection attempt. This is useful when monitoring remote or high-latency databases where the default timeout is too short.
-
PMM-14068: The PostgreSQL Instance Summary dashboard is now easier to read: summary panels use a consistent color scheme to help you spot issues faster, the layout fits laptop screens without cutting off panels, and tables no longer require horizontal scrolling to see all data.
-
PMM-14930: Building on the native PMM navigation introduced in 3.6.0, the Settings page now also runs in native PMM UI. You get the same settings with Metrics resolution, Advanced settings, and SSH key tabs in a page that loads faster and looks consistent with the rest of the new interface. Access it at Configuration > Settings in the left sidebar.

-
PMM-14995: PMM has been updated with Percona’s refreshed brand. You’ll notice the updated logo across the sidebar, login screen, and help center, along with new technology icons for MySQL, PostgreSQL, MongoDB, and Valkey, and a refreshed color palette throughout the interface.
✅ Fixed issues
-
PMM-14748: Fixed dashboards resetting the time zone to the browser default when navigating between pages. All dashboards now respect the time zone set in your profile preferences. See Set time zone.
-
PMM-14791: Resolved an issue in the Disk Space graphs on the Disk Details dashboard where values were hard to read, legend labels were missing, and charts were displayed incorrectly.
-
PMM-14512: Fixed the BP Data Dirty panel on the MySQL InnoDB Details dashboard showing no data after upgrading from PMM 2. The panel now correctly displays the ratio of dirty to data pages in the InnoDB buffer pool.
-
PMM-14851: Fixed a bug in the PMM Helm chart that could cause
ClusterRoleto fail when deploying PMM on Kubernetes. The chart now deploys without RBAC errors. -
PMM-14934: Fixed an issue where the
GF_SECURITY_ADMIN_USERandGF_SECURITY_ADMIN_PASSWORDenvironment variables were ignored when starting PMM Server with a named Docker volume (-v pmm-data:/srv). You can now use these variables to set the admin username and password at first start, regardless of how the data volume is mounted. As part of this fix, the first start after upgrading takes about 20–30 seconds longer than usual while PMM initializes. Subsequent starts are unaffected. PMM HA deployments are unimpacted.